BCG Matrix Template
Plot your portfolio on the classic growth-share matrix. Open this BCG matrix template, position each product, and export an editable PowerPoint slide.
Open this template → or start from scratch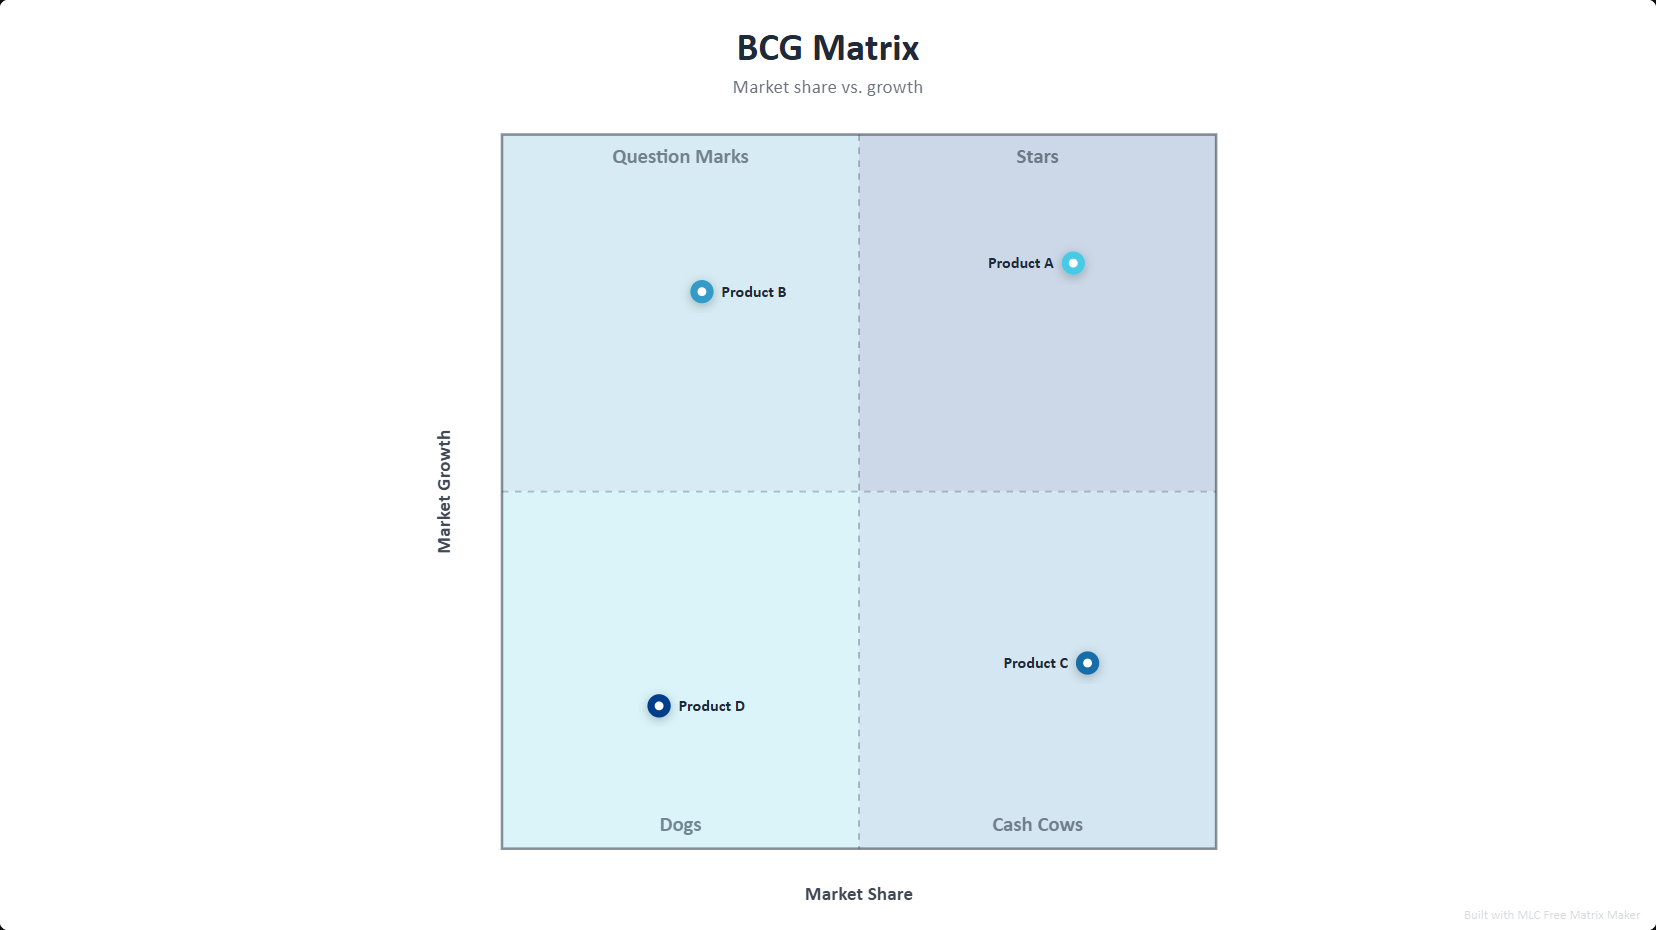
What is a BCG matrix?
The BCG matrix (growth-share matrix, from the Boston Consulting Group) positions products or business units on two axes: relative market share and market growth. The four quadrants are Stars (high share, high growth), Question Marks (low share, high growth), Cash Cows (high share, low growth) and Dogs (low share, low growth). It guides where to invest, hold or divest.
How to use this template
Open the template
Click the button above — the BCG matrix opens in the editor, already filled in. No signup.
Edit your data
Replace the sample entries with your own; the chart updates live as you type.
Style it
Pick a visual style and color palette to match your deck.
Export to PowerPoint
Download a .pptx with native, editable shapes — or PNG and Excel.
Ready in two minutes
Open the bcg matrix template, drop in your data, and export a native, editable PowerPoint slide — free, no signup, no watermark.
Open this template →Why export to PowerPoint matters
Most free chart tools give you a flat PNG, or lock PowerPoint export behind a paywall. This template exports real, editable PowerPoint shapes and text — so you can drop the chart straight into your deck and restyle it in PowerPoint, Google Slides or Keynote. That is the difference between a picture and a slide.
Frequently asked questions
Stars, Question Marks (or Problem Children), Cash Cows and Dogs — defined by relative market share and market growth. This template labels them for you.
Yes. The matrix exports as native, editable PowerPoint shapes, plus PNG and Excel.
Yes, completely free with no signup and no watermark.