Sales Funnel Template
Show your pipeline from lead to close. Open this sales funnel template, plug in your numbers, and export an editable PowerPoint slide with conversion rates.
Open this template → or start from scratch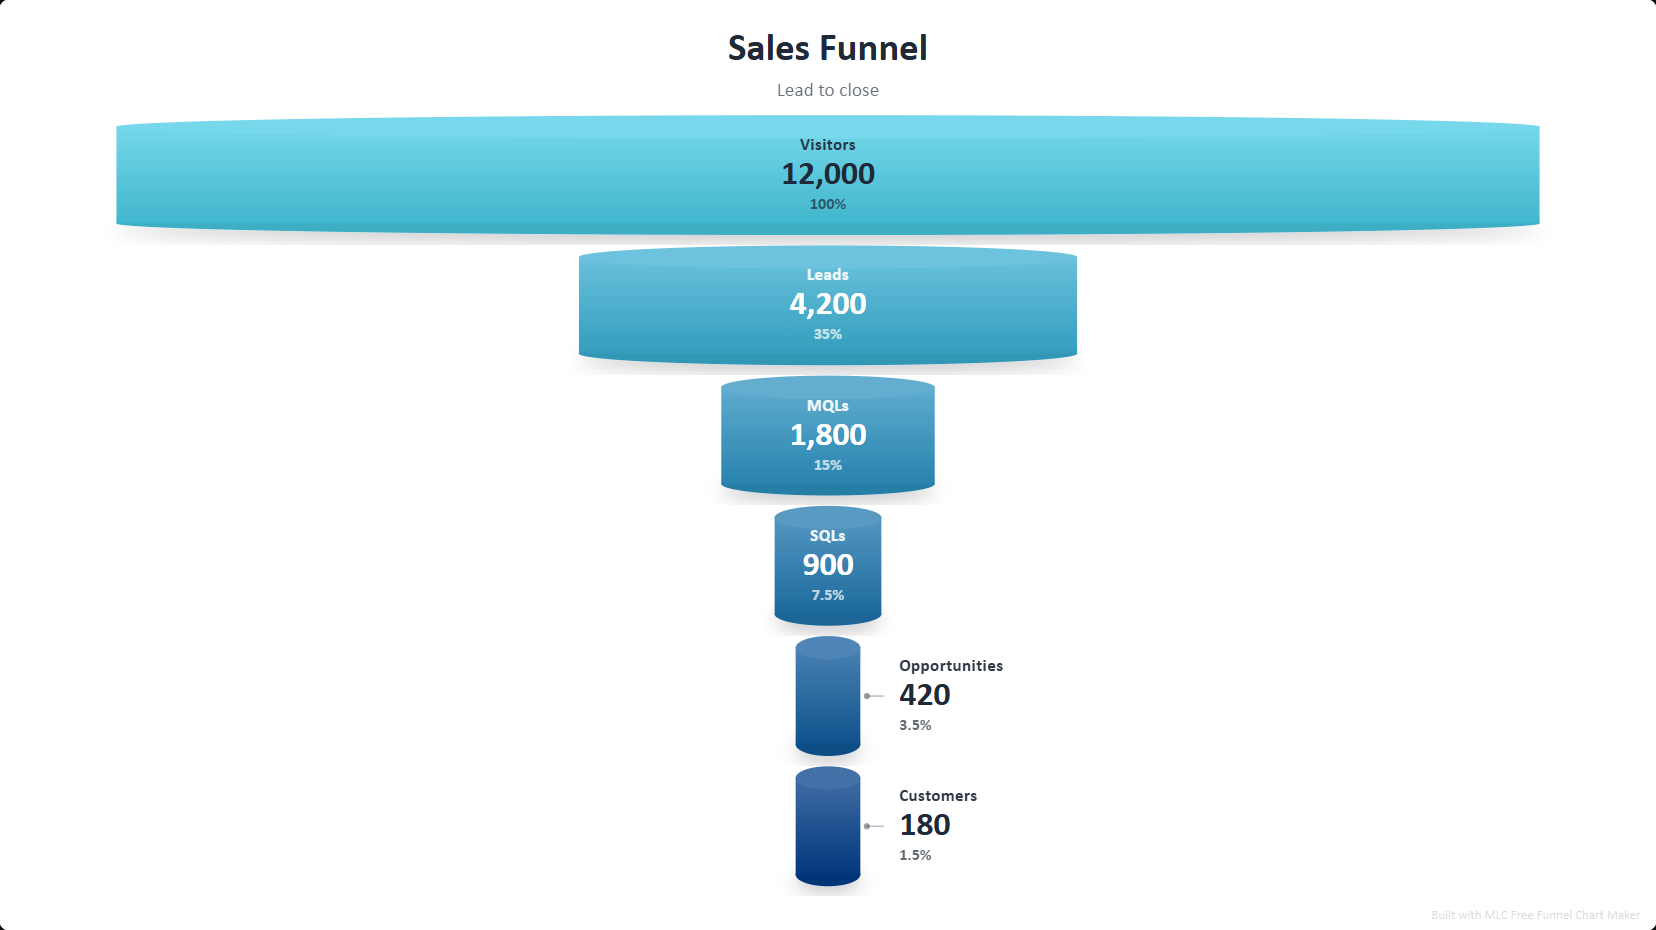
What is a sales funnel?
A sales funnel visualizes how prospects move through your pipeline — from leads and qualified opportunities down to proposals and closed deals — and shows the conversion and drop-off between each stage. It makes bottlenecks obvious and is a fixture of sales reviews and board decks.
How to use this template
Open the template
Click the button above — the sales funnel opens in the editor, already filled in. No signup.
Edit your data
Replace the sample entries with your own; the chart updates live as you type.
Style it
Pick a visual style and color palette to match your deck.
Export to PowerPoint
Download a .pptx with native, editable shapes — or PNG and Excel.
Ready in two minutes
Open the sales funnel template, drop in your data, and export a native, editable PowerPoint slide — free, no signup, no watermark.
Open this template →Why export to PowerPoint matters
Most free chart tools give you a flat PNG, or lock PowerPoint export behind a paywall. This template exports real, editable PowerPoint shapes and text — so you can drop the chart straight into your deck and restyle it in PowerPoint, Google Slides or Keynote. That is the difference between a picture and a slide.
Frequently asked questions
A stacked, narrowing chart showing how many prospects reach each stage of your pipeline and where they drop off. This template computes drop-off automatically.
Yes — native editable PowerPoint shapes, plus PNG and Excel with conversion rates.
Yes, 100% free, no signup, no watermark.