Revenue Bridge Template
Explain what moved the number. Open this revenue bridge template, enter your drivers, and export an editable PowerPoint waterfall with running totals.
Open this template → or start from scratch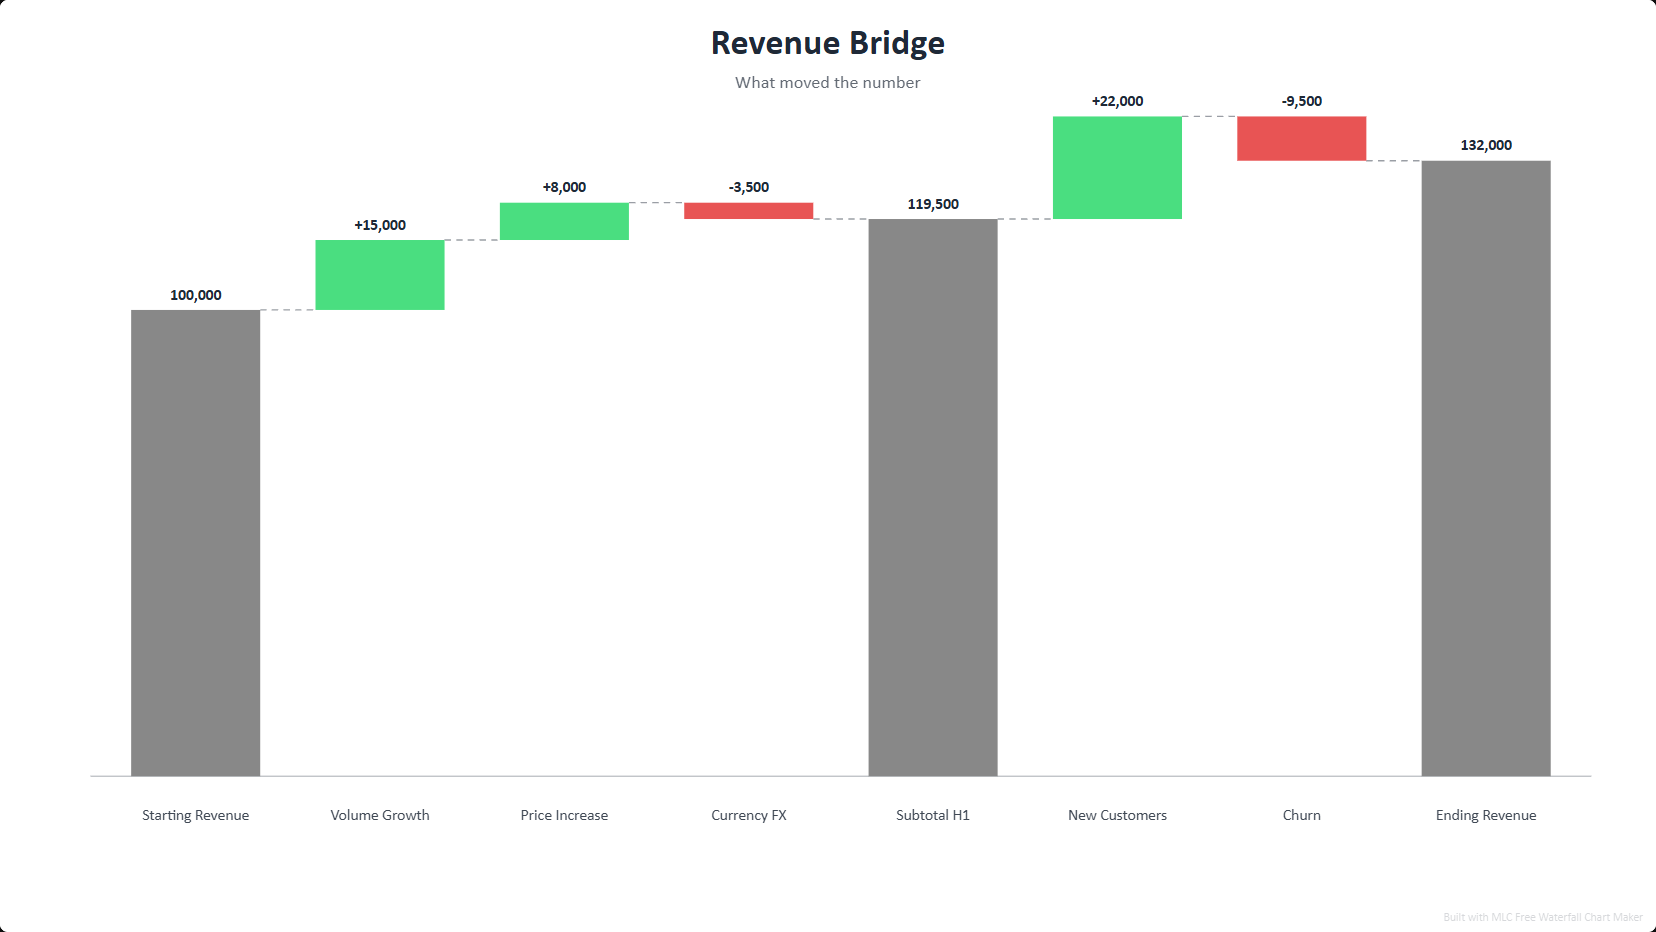
What is a revenue bridge?
A revenue bridge (a waterfall chart) breaks the change from a starting figure to an ending figure into its positive and negative drivers — new business, upsell, churn, price — so the story behind the number is obvious. Finance and strategy teams use bridges for board decks and variance reviews.
How to use this template
Open the template
Click the button above — the revenue bridge opens in the editor, already filled in. No signup.
Edit your data
Replace the sample entries with your own; the chart updates live as you type.
Style it
Pick a visual style and color palette to match your deck.
Export to PowerPoint
Download a .pptx with native, editable shapes — or PNG and Excel.
Ready in two minutes
Open the revenue bridge template, drop in your data, and export a native, editable PowerPoint slide — free, no signup, no watermark.
Open this template →Why export to PowerPoint matters
Most free chart tools give you a flat PNG, or lock PowerPoint export behind a paywall. This template exports real, editable PowerPoint shapes and text — so you can drop the chart straight into your deck and restyle it in PowerPoint, Google Slides or Keynote. That is the difference between a picture and a slide.
Frequently asked questions
A waterfall chart that connects a starting revenue figure to an ending one through the individual drivers that moved it. This template gives you the layout with running totals.
Yes — native editable PowerPoint shapes, plus PNG and Excel with running-total formulas.
Yes, 100% free, no signup, no watermark.