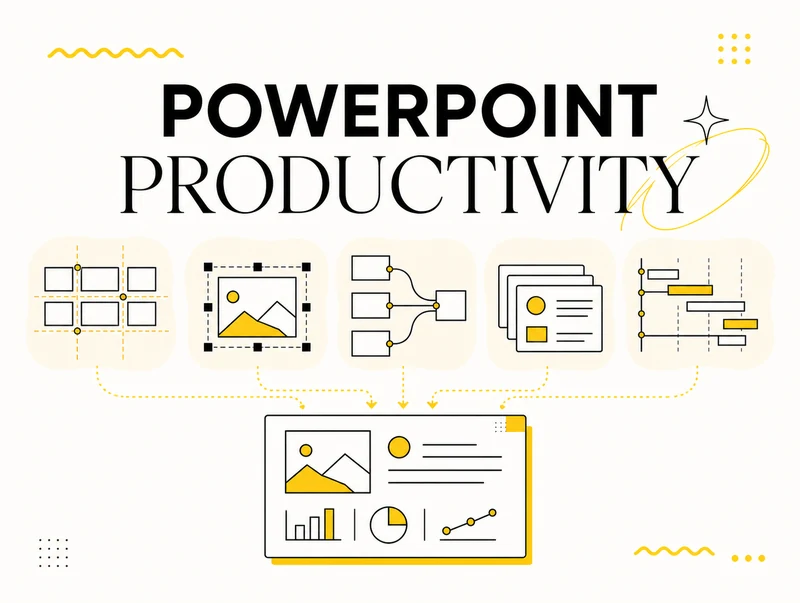

PowerPoint productivity is not about making slides as quickly as possible. It is about removing avoidable work while protecting the quality, accuracy and consistency of the presentation.
Most professionals do not lose time because they cannot use PowerPoint. They lose time because the same small jobs appear in every deck: aligning objects, fixing distorted images, rebuilding diagrams, searching for approved slides, updating timelines and checking whether everything still follows the brand.
This guide brings those recurring problems into one practical system. Start with the native PowerPoint method so that you understand what is happening. Then decide which tasks are frequent enough to standardize or automate.
What does PowerPoint productivity actually mean?
A productive PowerPoint workflow has four characteristics:
- Repeatable: the same task produces a consistent result across different presentations.
- Controllable: automation does not remove your ability to make design decisions.
- Reusable: good slides, layouts and assets do not disappear inside old files.
- Measurable: the time saved comes from fewer repetitive actions, fewer corrections and less searching.
The objective is not to automate judgment. It is to reserve your attention for the message, the story and the decisions the audience needs to make.
PowerPoint productivity workflow map
| Recurring problem | Native PowerPoint approach | Scalable approach |
|---|---|---|
| Objects drift out of alignment | Align and Distribute commands | Reusable alignment rules and one-click actions |
| Photos are stretched or inconsistent | Crop, Fit, Fill and aspect ratio | Standard crop-to-slide and multi-image routines |
| Diagrams become messy | Connectors, connection points and rerouting | Repeatable diagram cleanup |
| Teams reuse outdated slides | Shared folders and manual search | Searchable slide library with tags and permissions |
| Timelines take too long to update | Shapes, lines and text boxes | Editable timeline workflow |
| Project plans are rebuilt manually | Tables or shape-based Gantt charts | Repeatable Gantt creation and updating |
| Long decks are hard to navigate | Agenda slides and sections | Structured table of contents workflow |
| Every deck starts from zero | Templates and old presentations | A connected content and tool system |
1. Align shapes and distribute space consistently

Misalignment is one of the fastest ways to make a slide feel unfinished. The problem is rarely dramatic: a title is a few pixels too low, cards have slightly different gaps, or icons do not share the same centre line. These small inconsistencies accumulate.
PowerPoint already provides Align, Distribute Horizontally and Distribute Vertically. The important detail is understanding the reference: you can align selected objects to one another or align them to the slide. Selection order and the size of the objects also affect the final composition.
Use the complete guide to learn the native logic, spacing and troubleshooting: How to align shapes and objects in PowerPoint.
Productivity rule: do not move objects one by one with the mouse when the relationship between them can be expressed as an alignment or distribution rule.
2. Crop images without distortion
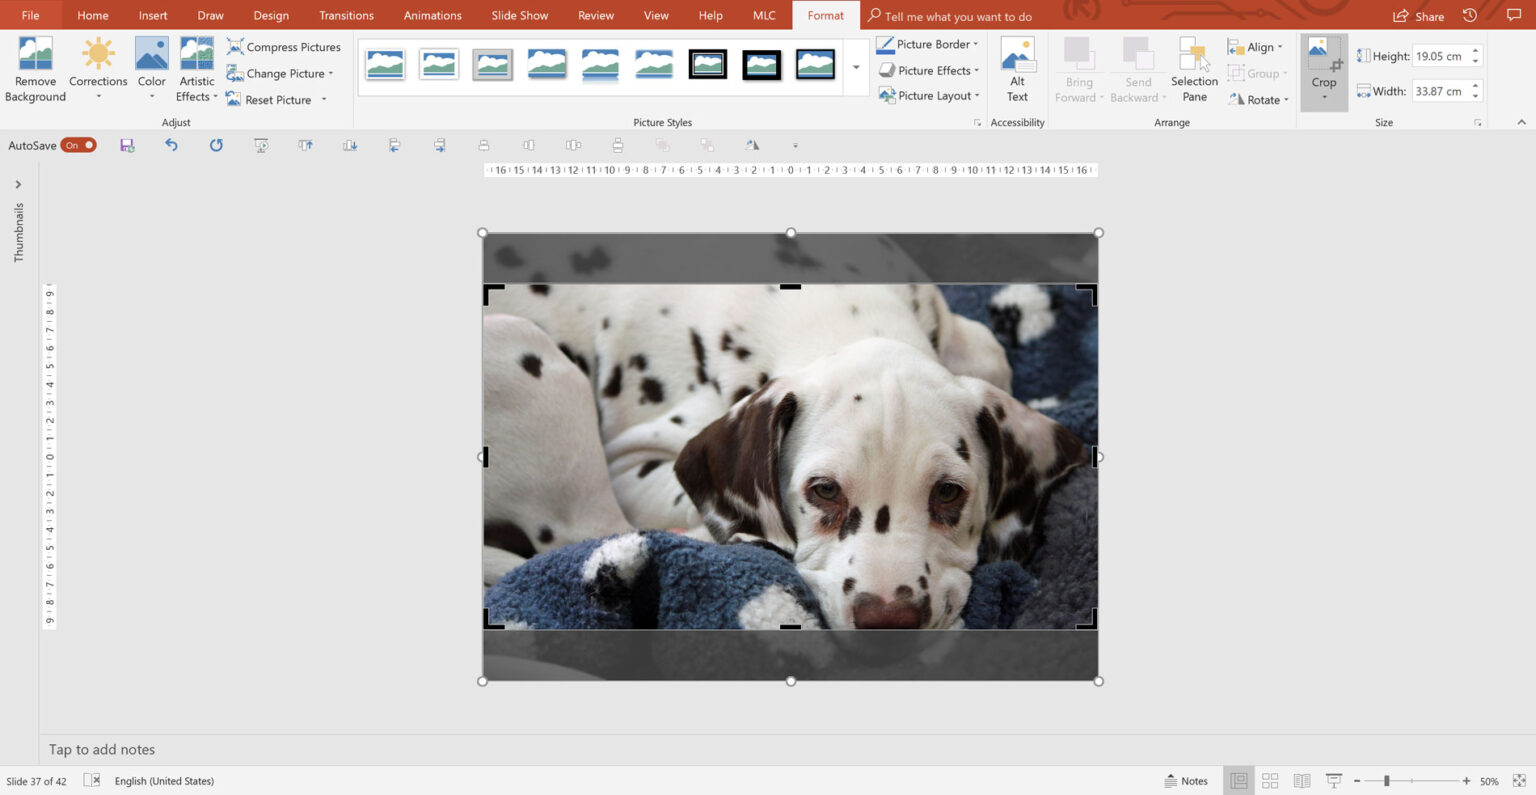
Dragging a side handle until a photograph fits a frame does not crop the image; it deforms it. A reliable image workflow separates three decisions:
- the proportions of the source image;
- the proportions of the destination frame or slide;
- the focal point that must remain visible.
Use Fit when the complete image must remain visible, even if this leaves empty space. Use Fill when the frame must be completely covered, accepting that part of the image may be hidden. For full-slide photographs, match the crop ratio to the slide format—usually 16:9—and check all four edges.
Follow the illustrated process in How to crop images in PowerPoint without distortion.
Productivity rule: create one correct image frame, duplicate it and replace the content instead of rebuilding every crop independently.
3. Build diagrams with connectors that stay attached
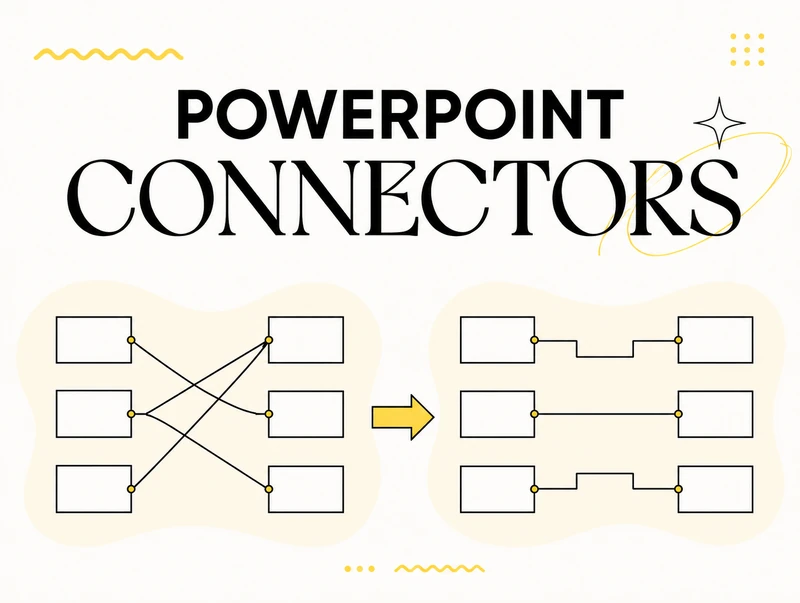
Ordinary lines and PowerPoint connectors are not interchangeable. A connector attaches to a shape through a connection point and follows the object when it moves. This is what makes a process diagram maintainable.
The difficult part is not drawing the first line. It is preserving a clear route when shapes are rearranged, connection points change or elbow connectors take an awkward direction. The best workflow is to establish the reading order first, keep spacing regular and reroute only after the structure is stable.
See the complete tutorial: How to use connectors effectively in PowerPoint.
Productivity rule: design the diagram as a system of relationships, not as a collection of decorative lines.
4. Create a searchable slide library
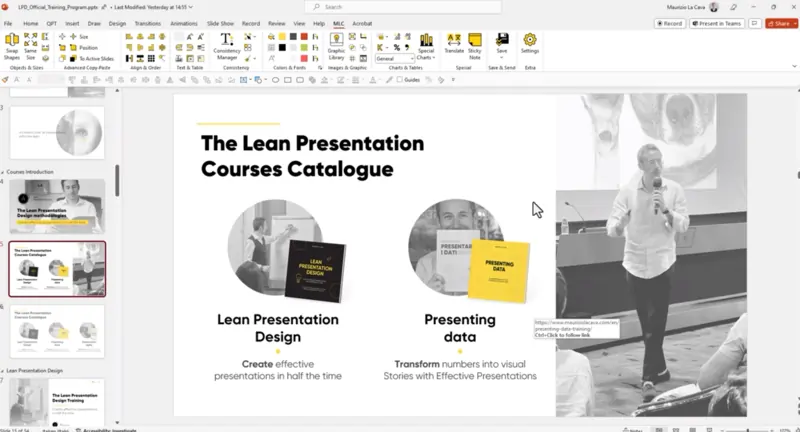
The most expensive slide is often one that already exists but nobody can find. Teams waste time recreating market maps, company profiles, methodology slides and case studies because approved material is buried in old decks.
A useful slide library needs more than a shared folder. It should include:
- thematic folders that reflect how people search;
- tags for industry, message, slide type and use case;
- ownership and update rules;
- permissions for viewing and editing;
- a process for retiring obsolete slides.
Use How to create a slide library in PowerPoint to build the structure and understand how the MLC PowerPoint Add-in supports folders, tags and shared material.
Productivity rule: make the approved version easier to find than the outdated version.
5. Turn timelines into editable communication tools
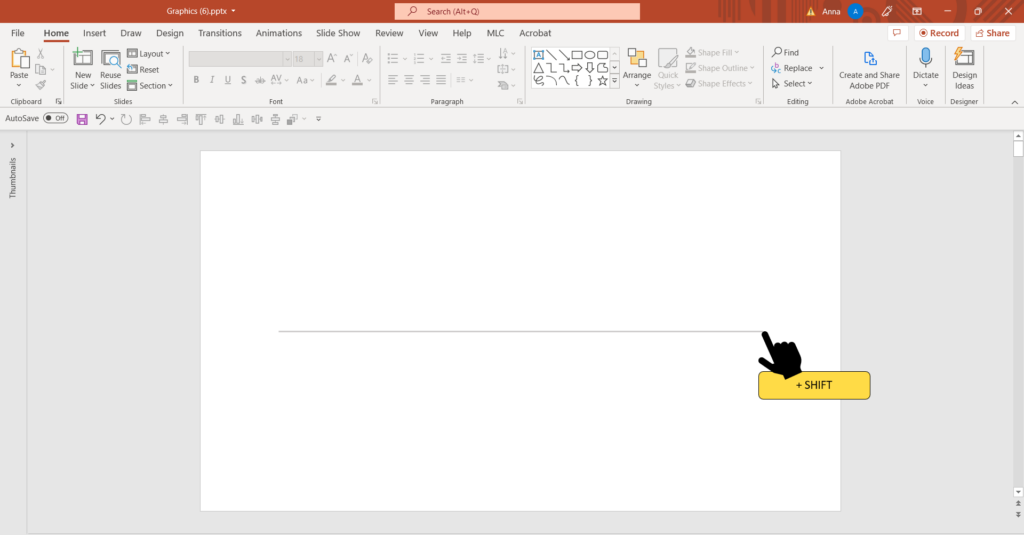
A timeline is useful only if the audience can understand sequence, milestones and current status quickly. When it is built from dozens of unrelated shapes, every update becomes a redesign project.
For occasional work, native PowerPoint shapes may be sufficient. Keep the time scale consistent, separate milestones from activities and use emphasis only for the information that changes the discussion. For recurring reporting, use a workflow that keeps dates and visual elements connected.
Explore the dedicated Timeline Add-in for PowerPoint guide before deciding whether the native or automated approach fits your frequency of use.
Productivity rule: choose the simplest timeline that can survive the next update.
The same logic extends to AI. Once the timeline exists as an editable object rather than a picture, Copilot can populate it from data you already have on another slide: this walkthrough shows the prompt, starting from a layout downloaded from the MLC assets portal.
6. Create Gantt charts without rebuilding the plan

Gantt charts in presentations are communication artifacts, not project-management databases. Their purpose is to show phases, dependencies, ownership and timing at the level the audience needs.
Start by reducing the project plan to the activities that matter in the meeting. Use a stable time scale, group related workstreams and make status visually distinct from duration. If the chart is updated frequently, separate the underlying data from the presentation formatting so that one change does not trigger dozens of manual edits.
The practical starting point is How to create a Gantt chart in PowerPoint.
Productivity rule: do not reproduce every row of the project plan; design the decision view.
7. Make long presentations easier to navigate

An agenda or table of contents is more than an opening slide. It helps the audience understand the structure and helps the presenter move through the deck.
For short linear presentations, a simple numbered agenda may be enough. For workshops, proposals and reference decks, consider PowerPoint sections, hyperlinks or Section Zoom. Keep labels consistent with the section titles used later in the presentation.
Use the PowerPoint table of contents guide to compare the available methods.
Productivity rule: navigation should reduce cognitive load, not add another decorative slide.
8. Decide when an add-in is worth using

An add-in is valuable when the cost of a recurring problem is higher than the cost of standardizing the solution. Frequency matters more than novelty.
Ask four questions:
- How often does this task appear?
- How many people repeat it?
- What happens when the result is inconsistent?
- Does the tool keep the output editable in PowerPoint?
The comparison guide Best PowerPoint add-ins for business presentations explains where MLC, think-cell and Lucen Timeline fit, including limitations and pricing context.
MLC PowerPoint Add-in is designed for recurring slide-production work on Windows, including alignment, images, reusable slide assets, timelines, Gantt charts and other presentation-design routines. The individual plan is EUR 149 per year and includes a 7-day free trial.
Try MLC PowerPoint Add-in for 7 days
A practical weekly PowerPoint productivity routine
Before starting a new presentation:
- define the decision or action the deck must support;
- start from the correct template;
- search the slide library before designing from zero;
- identify which charts, timelines or diagrams will need updates;
- choose reusable layouts for repeated content.
Before sharing the presentation:
- run an alignment and spacing pass;
- check image proportions and resolution;
- move shapes to confirm that connectors remain attached;
- test agenda links and section navigation;
- remove obsolete or hidden material;
- confirm that every slide follows the current brand system.
This routine is deliberately simple. Productivity comes from making it habitual.
Frequently asked questions
What is the fastest way to improve PowerPoint productivity?
Identify the three repetitive tasks that consume the most time in your own workflow, define a consistent native method for each one and automate only the tasks that occur frequently. Alignment, image preparation and reuse of existing slides are common starting points.
Should I use templates or a slide library?
Use both. A template controls fonts, colours, placeholders and standard layouts. A slide library stores complete reusable slides and content modules. They solve different parts of the consistency problem.
Can PowerPoint productivity be improved without an add-in?
Yes. Native alignment tools, crop controls, sections, hyperlinks, connectors and disciplined templates already eliminate significant waste. An add-in becomes useful when those routines are frequent, shared by a team or difficult to maintain consistently.
Is MLC PowerPoint Add-in available for Mac?
The current MLC PowerPoint Add-in workflow described here is for Windows. Check the product page for the latest compatibility information before starting a trial.
How should a team measure PowerPoint productivity?
Track time spent searching for existing material, time required to update recurring slides, number of brand corrections, duplicated slides and adoption of approved templates or libraries. Measure the workflow before and after standardization.
TURN REPEATED WORK INTO A SYSTEM
MLC PowerPoint Add-in automates recurring routines while keeping every slide fully editable.
Download the PDF guide
Get the formatted version of this guide and use it as a checklist while you work on your slides.


Comments on PowerPoint Productivity: 8 Workflows to Build Better Slides Faster